
You’ve probably heard of Elasticsearch (opens in new tab) – the search engine that enables you to index and then quickly search through your data. You may have created a few visualizations in Kibana, the GUI for Elasticsearch, pointing and clicking your way through the sleek interface.
What you may not have used is a lesser-known visualization (opens in new tab) plugin called Timelion (opens in new tab).
Timelion is a fantastic visualization creation tool that makes it possible to write out your queries in its simple and powerful expression language to display graphs. It’s used for displaying time-series data such as population growth or hits to your website (opens in new tab).
- Here’s a list of the best laptops for developers (opens in new tab)
- Check these best distros for developers (opens in new tab)
- Crunch numbers with ease on these best workstations (opens in new tab)
This article first appeared in Linux Format Magazine, Issue #269, published in November 2020.
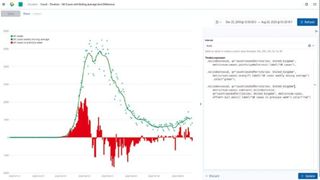
With Timelion, we can calculate moving averages, display the difference between the data for last week and today, and do some basic anomaly detection. It’s a useful tool to know how to work with. Let’s get started.
Installation
If you’re a regular Linux Format reader, there are docker (opens in new tab) compose examples for setting up a cluster in LXF261.
Otherwise installing Elasticsearch and Kibana is relatively straightforward. The only requirement is Java, which you may already have installed.
If not a simple sudo apt install default-jre installs it on Debian-based distros (opens in new tab) or a sudo dnf install java should do the same for the Red Hat family of distros.
Then you just need to download the latest version (opens in new tab) of Elasticsearch and Kibana for your desired operating system flavour.
At the time of writing the latest version is kibana-7.8.1-linux-x86_64.tar.gz.
You can extract it with tar -xvzf kibana-7.8.1-linux-x86_64.tar.gz, change into the extracted directory and run ./bin/kibana & to fire up the Kibana instance.
When you’ve done exactly the same steps to set up Elasticsearch, replacing ‘kibana’ for ‘elasticsearch’, you should be able to navigate to http://localhost:5601 in your favourite browser and see a shiny new Kibana interface to play around with.
If you prefer to install packages with a package manager, the same link as before has information about adding the Elastic repo to your system and installing the Kibana and Elasticsearch packages that way.
Get some data
Recent versions of Kibana makes it possible to ingest datasets into our cluster automatically with the Data Visualizer instead of needing to create a script or Logstash config. It can deal with datasets in JSON or CSV format as well as some standard log files such as Apache logs. The only limitation is that they’re less than 100MB in size. This is more than enough for our purposes.
We’ll be using the Covid-19 cases worldwide dataset from the EU Open Data Portal (opens in new tab). We downloaded the CSV file from the Resources section of the page.
If you have issues, you could choose to download the Excel .xlsx version instead, open with LibreOffice Calc and save it as Text CSV(.csv) format. There’s also a JSON version available for download that you can use as an alternative.
To get to the Data Visualizer in Kibana, click the hamburger icon in the top left, then Machine Learning and finally Data Visualizer. Once there click Upload file within the Import data box, then Select or drag and drop a file and choose your csv file to ingest.
After some short analysis, it will show some stats that it’s discovered from the first 1,000 lines of the CSV file. This will be what format it thinks each of the fields is in, such as text, date or number and highlight the top values found in the fields.
It usually does a good job figuring this out for us. If you needed to make any adjustments, you could click Override Settings to amend – for example, the name of the field as it will be set in Elasticsearch.
オーバーライドする必要があるフィールド名の 1 つはdateRepで、これはデータセット内の計算された数値の日付を表します。Timelion はデフォルトではこれを時間フィールドとして使用する方法を知りません。そのため、ここでこのフィールドを認識できる名前に変更することで、後で作業を簡素化できます。
適切な候補はtimestampです。「適用」をクリックして設定します。残りの見た目に満足したら、下部にある [インポート] をクリックし、インデックスに名前を付けます (ここでは「covid」を選択しました)。それからもう一度 [インポート] をクリックしてデータをクラスターに取り込みます。